Most indoor cannabis growers obsess over nutrients, lighting schedules, and training techniques, yet the single environmental variable that controls whether your plants can actually use any of those inputs goes largely misunderstood. Vapor pressure deficit, or VPD, is the atmospheric “drying pressure” that determines how aggressively your plants transpire, and a 2024 study published in PMC (National Library of Medicine) confirmed that optimizing vapor pressure deficit in controlled cultivation environments produces measurable improvements in biomass accumulation and secondary metabolite production, including cannabinoids and terpenes. In my seven years of researching plant chemistry, I’ve watched growers spend thousands of dollars on premium LED arrays and precision nutrients, then lose 20–30% of their potential yield because their grow room’s VPD was running at 0.3 kPa during flower. That’s the kind of invisible tax this guide is designed to eliminate.
- What Is VPD and Why Does It Matter More Than RH Alone?
- The VPD Formula: How to Calculate It Yourself
- How to Read a Cannabis VPD Chart
- Stage-by-Stage VPD Optimization: The Complete Timeline
- The VPD Chart Visualized: Celsius and Fahrenheit Versions
- How to Adjust Temperature and Humidity to Hit Your VPD Target
- VPD, Terpene Production, and the Entourage Effect Connection
- VPD and Disease Prevention: The Mold and Mildew Connection
- Common VPD Mistakes and Why Plants Fail Despite “Correct” Numbers
- VPD Monitoring Equipment: What You Actually Need
- VPD for Autoflowering Cannabis: Special Considerations
- Integrating VPD with Your Full Environmental Strategy
- VPD Chart Tools: Comparing Your Options
What Is VPD and Why Does It Matter More Than RH Alone?
VPD, vapor pressure deficit, is the difference between the amount of moisture the air currently holds and the maximum moisture it could hold at a given temperature, expressed in kilopascals (kPa). It is not simply humidity. Relative humidity (RH) tells you how saturated the air is as a percentage, but it tells you nothing about the actual drying pressure that air exerts on your plant’s leaf surface. VPD quantifies that drying pressure directly, and that distinction is everything.
Here’s why this matters at a physiological level: cannabis plants regulate transpiration through stomata, microscopic pores on leaf surfaces that open and close in response to atmospheric demand. When VPD is appropriately elevated, stomata open wide, water moves through the plant from roots to leaves, and in that water column rides every dissolved nutrient your roots have absorbed. Calcium, magnesium, nitrogen, all of it travels via transpiration flow. When VPD is too low, stomata partially close, transpiration slows, nutrient transport stalls, and growth visibly decelerates even when your reservoir is perfectly dialed. When VPD is too high, stomata slam shut as a drought-stress response, and you get the same nutrient lockout from the opposite direction.
I often describe VPD to new growers as the “atmospheric hunger” of your grow room. A hungry atmosphere pulls moisture efficiently from your plants, keeping metabolic processes running at full speed. An oversaturated atmosphere is indifferent, it can’t accept more moisture, so your plants stop offering it. Understanding this mechanism is why experienced growers on forums across the US consistently report that fixing VPD resolves the overwhelming majority of what appear to be nutrient deficiencies, slow growth complaints, and unexplained yield drops.
The VPD Formula: How to Calculate It Yourself
Calculating VPD requires two measurements, air temperature and relative humidity, and a straightforward formula that any grower can apply with a basic digital thermometer/hygrometer combo. The full formula uses the Magnus approximation to derive saturation vapor pressure, but for practical grow room use, the working equation is:
VPD = SVP × (1 − RH/100)
Where SVP (Saturation Vapor Pressure) is calculated as:
SVP = 0.6108 × e^(17.27 × T / (T + 237.3))
In this formula, T is temperature in Celsius and e is Euler’s number (approximately 2.718). The result is expressed in kilopascals. Let me walk through a concrete example: if your grow room is running at 25°C (77°F) with 60% relative humidity, the SVP at 25°C is approximately 3.17 kPa. Multiplying 3.17 by (1 − 0.60) gives you a VPD of approximately 1.27 kPa, which sits comfortably in the early flowering target range I’ll detail shortly.
The critical refinement that separates advanced growers from beginners is accounting for leaf surface temperature, which is typically 1–3°C cooler than ambient air temperature due to evaporative cooling. This matters because VPD is technically the relationship between leaf temperature and room relative humidity, not air temperature and room RH. When you use air temperature in your calculation, you’re slightly overestimating the VPD your plant actually experiences. Tools like the interactive calculator at vpdchart.com allow you to input a leaf temperature offset, I recommend using a 2°C offset as a default starting point for most well-ventilated indoor grows, adjusting based on your specific airflow dynamics.
For Fahrenheit users, the same calculation applies after converting: subtract 32 from your °F reading, then multiply by 5/9 to get Celsius. Most modern grow room controllers and VPN monitoring apps handle this conversion automatically, but understanding the underlying math gives you the diagnostic ability to troubleshoot sensor discrepancies when they arise.
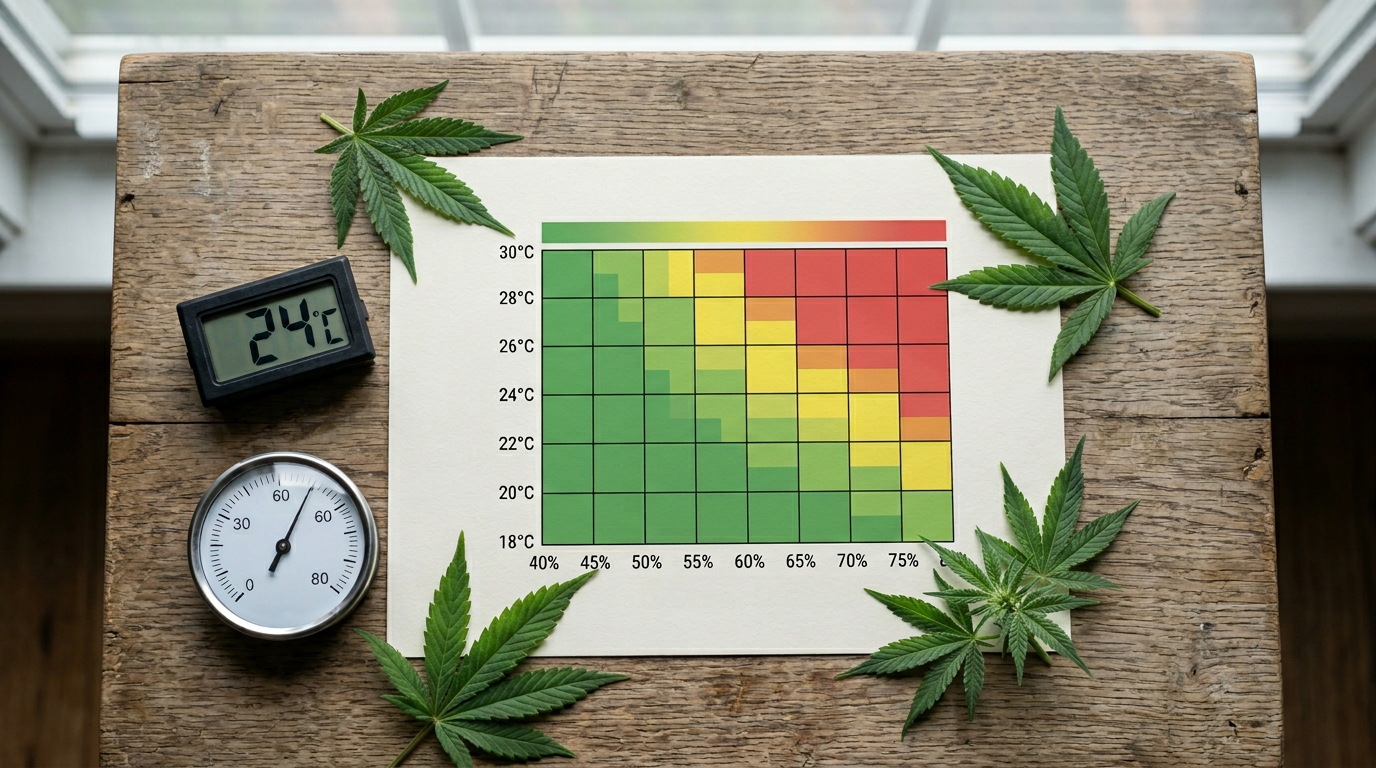
How to Read a Cannabis VPD Chart
A standard cannabis VPD chart is a color-coded grid where temperature runs along one axis (typically horizontal) and relative humidity runs along the other (typically vertical), with each cell showing the calculated VPD value for that temperature-humidity intersection, color-coded from blue (too low/danger zone) through green (optimal) to red (too high/stress zone). Reading it correctly takes about 90 seconds to learn and saves you from having to run the formula manually every time conditions shift.
To read any VPD chart: locate your current air temperature on the horizontal axis, trace upward to find your current relative humidity on the vertical axis, and read the VPD value at that intersection. The color of that cell tells you immediately whether you’re in the optimal zone for your current growth stage. If you’re in blue territory, your air is too saturated and you need to raise temperature, reduce humidity, or both. If you’re in red territory, your atmosphere is too dry and you need to lower temperature, raise humidity, or both.
The more nuanced skill is knowing which optimal zone to target, because the correct VPD range changes at every stage of the cannabis lifecycle. A chart that shows a single “optimal” green band is oversimplifying. The most useful VPD charts for cannabis cultivation display separate overlays for seedling, early veg, late veg, early flower, and late flower stages, because each phase has distinct transpiration requirements tied to root development, canopy density, and metabolic priorities.
| Growth Stage | VPD Range (kPa) | Temp Range (°C) | Temp Range (°F) | Target RH (%) |
|---|---|---|---|---|
| Seedling / Clone | 0.4–0.8 | 20–25 | 68–77 | 65–80 |
| Early Vegetative | 0.4–0.8 | 20–28 | 68–82 | 60–75 |
| Late Vegetative | 0.8–1.1 | 22–28 | 72–82 | 50–65 |
| Early Flower (Wk 1–4) | 1.0–1.2 | 20–26 | 68–79 | 45–55 |
| Late Flower (Wk 5–8) | 1.2–1.6 | 18–24 | 64–75 | 40–50 |
| Ripening / Final Weeks | 1.0–1.3 | 18–22 | 64–72 | 40–45 |
Stage-by-Stage VPD Optimization: The Complete Timeline
Achieving ideal VPD is not a set-and-forget operation, it is an active, stage-dependent management process that mirrors the plant’s shifting physiological needs from germination through harvest. Each phase below represents a distinct metabolic mode that demands a specific atmospheric environment.
Seedling and Clone Stage (VPD: 0.4–0.8 kPa)
Seedlings and fresh clones require the lowest VPD of any growth stage because their root systems are either absent or severely underdeveloped, meaning they cannot yet replenish moisture lost through transpiration at the rate a mature plant can. At this stage, the priority is maintaining a high-humidity, low-drying-pressure environment that minimizes transpiration demand while roots establish. I typically target 70–80% RH at 22–24°C for seedlings, which produces a VPD in the 0.4–0.6 kPa range. Dome environments and propagation chambers are ideal because they create a microclimate that naturally maintains this low-VPD condition without requiring constant HVAC intervention.
Early Vegetative Stage (VPD: 0.4–0.8 kPa)
As plants transition into active vegetative growth with a developing root system, the VPD target remains relatively low but begins shifting upward toward the 0.6–0.8 kPa range. This is where warmer temperatures begin paying dividends, research consistently shows that elevated temperatures during vegetative growth accelerate metabolic processes including photosynthesis and nutrient uptake, leading to faster growth rates. The ideal vegetative temperature window is 20–28°C (68–82°F), and within that range, the higher end (around 26–28°C) combined with appropriately adjusted humidity (around 60–65% RH) produces the faster vegetative growth rates most growers are chasing. The complete home growing guide covers how to integrate VPD targets into a full cultivation timeline for new growers setting up their first environment.
Late Vegetative Stage (VPD: 0.8–1.1 kPa)
Late veg is where VPD management begins requiring more deliberate control. As canopy density increases, the microclimate within the canopy becomes increasingly different from the ambient room environment, a phenomenon that becomes critical to manage. At this stage, I recommend beginning to lower RH gradually toward 50–60% while maintaining temperatures in the 22–26°C range, which naturally pushes VPD into the 0.8–1.1 kPa target zone. This is also when robust air circulation becomes non-negotiable: without adequate airflow moving through the canopy, pockets of stagnant, high-humidity air form at leaf level, creating localized low-VPD zones that invite powdery mildew and other fungal pathogens regardless of what your room sensors read.
Transition Period: Veg to Flower (VPD: 0.9–1.1 kPa)
The transition week, when you flip to 12/12 photoperiod, is a stage most VPD guides skip entirely, and it’s where I see growers make expensive mistakes. The plant is undergoing a dramatic hormonal shift (the surge in ethylene and the decline in cytokinin-to-auxin ratios), and metabolic demand spikes. I maintain VPD in the 0.9–1.1 kPa range during this window, which supports the increased transpiration demand without pushing into early flower territory before the plant has fully committed to reproductive growth. Rushing VPD upward during transition can stress plants at exactly the wrong moment, sometimes triggering hermaphroditism in stress-sensitive genetics.
Early Flowering Stage (VPD: 1.0–1.2 kPa)
Early flower, roughly weeks one through four of the flowering period, is when VPD management starts delivering the most visible returns on investment. Trichome development, terpene biosynthesis, and bud site proliferation all accelerate when stomata are operating at optimal aperture, which the 1.0–1.2 kPa range reliably produces. Temperature should be dropping slightly relative to late veg, targeting 20–26°C (68–79°F), while RH comes down to the 45–55% range. Strains with dense bud architecture, think Gorilla Glue cannabis, Wedding Cake, or Ice Cream Cake, particularly benefit from precise early-flower VPD management because their tight calyxes create interior microenvironments that are prone to moisture accumulation and botrytis if ambient VPD isn’t pulling moisture out efficiently.
Late Flowering Stage (VPD: 1.2–1.6 kPa)
Late flower is the highest-VPD phase of the cannabis lifecycle, and it’s where growers who haven’t been actively managing their environment often find their equipment limitations exposed. The 1.2–1.6 kPa target range requires RH in the 40–50% zone at temperatures of 18–24°C (64–75°F), a combination that demands either a capable dehumidifier or a climate controller that can coordinate cooling and dehumidification simultaneously. The elevated VPD during this phase serves two critical functions: it maximizes resin production by maintaining the transpiration-driven stress signals that upregulate terpene and cannabinoid biosynthesis, and it dramatically reduces the risk of botrytis (bud rot), which is the single most devastating late-flower pathogen in commercial and home grows across the US.
Ripening Phase (VPD: 1.0–1.3 kPa)
In the final one to two weeks before harvest, I recommend slightly backing off VPD to the 1.0–1.3 kPa range by allowing temperatures to cool to 18–22°C (64–72°F) while maintaining low RH. This mimics the natural late-season conditions that cannabis evolved under in its native mountain environments, cooler nights, lower humidity, and the physiological response is often enhanced anthocyanin expression (the purple coloration mechanism I explore in depth in our guide to purple cannabis genetics) and a final push in terpene concentration as the plant senses the approaching end of its reproductive window. The complete harvest timing guide pairs well with this section for growers optimizing their final-week environment.
The VPD Chart Visualized: Celsius and Fahrenheit Versions
| RH % | 18°C | 20°C | 22°C | 24°C | 26°C | 28°C | 30°C |
|---|---|---|---|---|---|---|---|
| 40% | 1.24 | 1.40 | 1.58 | 1.78 | 2.00 | 2.24 | 2.51 |
| 45% | 1.14 | 1.29 | 1.45 | 1.63 | 1.83 | 2.05 | 2.30 |
| 50% | 1.03 | 1.17 | 1.32 | 1.49 | 1.67 | 1.87 | 2.10 |
| 55% | 0.93 | 1.05 | 1.19 | 1.34 | 1.50 | 1.68 | 1.89 |
| 60% | 0.83 | 0.93 | 1.06 | 1.19 | 1.33 | 1.50 | 1.68 |
| 65% | 0.72 | 0.82 | 0.92 | 1.04 | 1.17 | 1.31 | 1.47 |
| 70% | 0.62 | 0.70 | 0.79 | 0.89 | 1.00 | 1.12 | 1.26 |
| 75% | 0.52 | 0.58 | 0.66 | 0.74 | 0.83 | 0.94 | 1.05 |
| 80% | 0.41 | 0.47 | 0.53 | 0.59 | 0.67 | 0.75 | 0.84 |
How to Adjust Temperature and Humidity to Hit Your VPD Target
Knowing your target VPD range is only half the equation, the practical skill is knowing which environmental levers to pull when you’re outside that range. There are essentially four scenarios a grower encounters, and each has a prioritized response protocol.
Scenario 1: VPD Is Too Low (Below Target), Air Is Too Saturated
This is the most common problem in home grows, particularly in basement setups in humid US states like the Pacific Northwest, the Southeast, and the Great Lakes region. When VPD reads below your stage-appropriate target, your options in order of preference are: first, increase temperature (which raises SVP and thus VPD without changing the absolute moisture content of the air); second, run a dehumidifier to reduce RH directly; third, increase air exchange rate to bring in drier outside air. Increasing temperature is often the fastest and cheapest first response, raising your grow room from 22°C to 25°C at the same RH of 65% moves VPD from approximately 0.92 kPa to approximately 1.17 kPa, potentially bringing you from below-target into the early flower optimal zone without touching your dehumidifier at all.
Scenario 2: VPD Is Too High (Above Target), Air Is Too Dry
Excessive VPD causes overdrying and plant stress through rapid, uncontrolled transpiration, stomata close as a stress response, nutrient uptake collapses, and plants can show symptoms that look deceptively like calcium or magnesium deficiency. When VPD is above target, the response protocol is: first, add a humidifier or evaporative source to raise RH; second, lower temperature slightly; third, increase canopy density (more leaf area = more transpired moisture = natural humidity contribution). In arid US climates like Nevada, Arizona, and Southern California, high-VPD problems are endemic and growers in these regions should budget for a quality ultrasonic humidifier as a non-negotiable piece of equipment.
Scenario 3: Temperature Is Correct But RH Is Wrong
This scenario calls for direct humidity manipulation without touching temperature. A dehumidifier sized appropriately for your grow space (calculate based on cubic footage plus plant transpiration load) is the primary tool. For a 4×4 tent running 8–12 plants in late flower, I typically recommend a 30-pint-per-day dehumidifier as a minimum. For larger commercial-style setups in states like California, Colorado, or Michigan where regulated grows face strict environmental documentation requirements, commercial-grade climate controllers that integrate temperature, humidity, CO2, and VPD monitoring into a single dashboard have become standard practice.
Scenario 4: Both Temperature and RH Are Suboptimal
This is the most complex scenario and the one that benefits most from a VPD chart reference. The chart allows you to identify multiple temperature-humidity combinations that all produce your target VPD, giving you flexibility to choose the combination that’s most achievable with your existing equipment. For example, a target VPD of 1.2 kPa can be achieved at 24°C/55% RH, 26°C/60% RH, or 22°C/50% RH, three very different environmental configurations that all deliver identical VPD at the leaf level. The indoor growing setup guide provides detailed equipment recommendations for building a climate-controllable grow space from scratch.
VPD, Terpene Production, and the Entourage Effect Connection
One of the most underappreciated dimensions of VPD optimization is its direct impact on the terpene profiles that drive the entourage effect, the synergistic interaction between cannabinoids and terpenes that shapes the character of every strain’s effects. In my research into cannabinoid-terpene interactions, I’ve found that the biosynthetic pathways for monoterpenes (like limonene, pinene, and linalool) and sesquiterpenes (like myrcene and caryophyllene) are both regulated by the same transcription factors that respond to osmotic stress signals, signals that are directly influenced by transpiration rate, which VPD controls.
When plants operate at optimal VPD during late flowering, the mild, controlled transpiration stress upregulates the MEP (methylerythritol phosphate) pathway, which is the primary route for terpene biosynthesis in cannabis. Conversely, when VPD is chronically too low during flowering, terpene production is suppressed alongside the broader metabolic slowdown. This is why two harvests of the same strain, say, Blue Dream cannabis or Sour Diesel cannabis, can smell dramatically different when grown under different environmental conditions. The genetics establish the potential; VPD determines how much of that potential is expressed.
The entourage effect itself, the complex interplay between THC, CBD, and the full terpene profile, is explored in exhaustive detail in our entourage effect deep dive, and understanding that science makes the case for VPD optimization even more compelling. You’re not just growing bigger buds, you’re cultivating a richer, more complex chemical expression of your strain’s genetic blueprint. Our terpene specialist Darrel Henderson has documented this phenomenon across multiple grow cycles, noting that late-flower VPD management consistently ranks among the top three variables affecting final terpene concentration in his controlled grow comparisons.
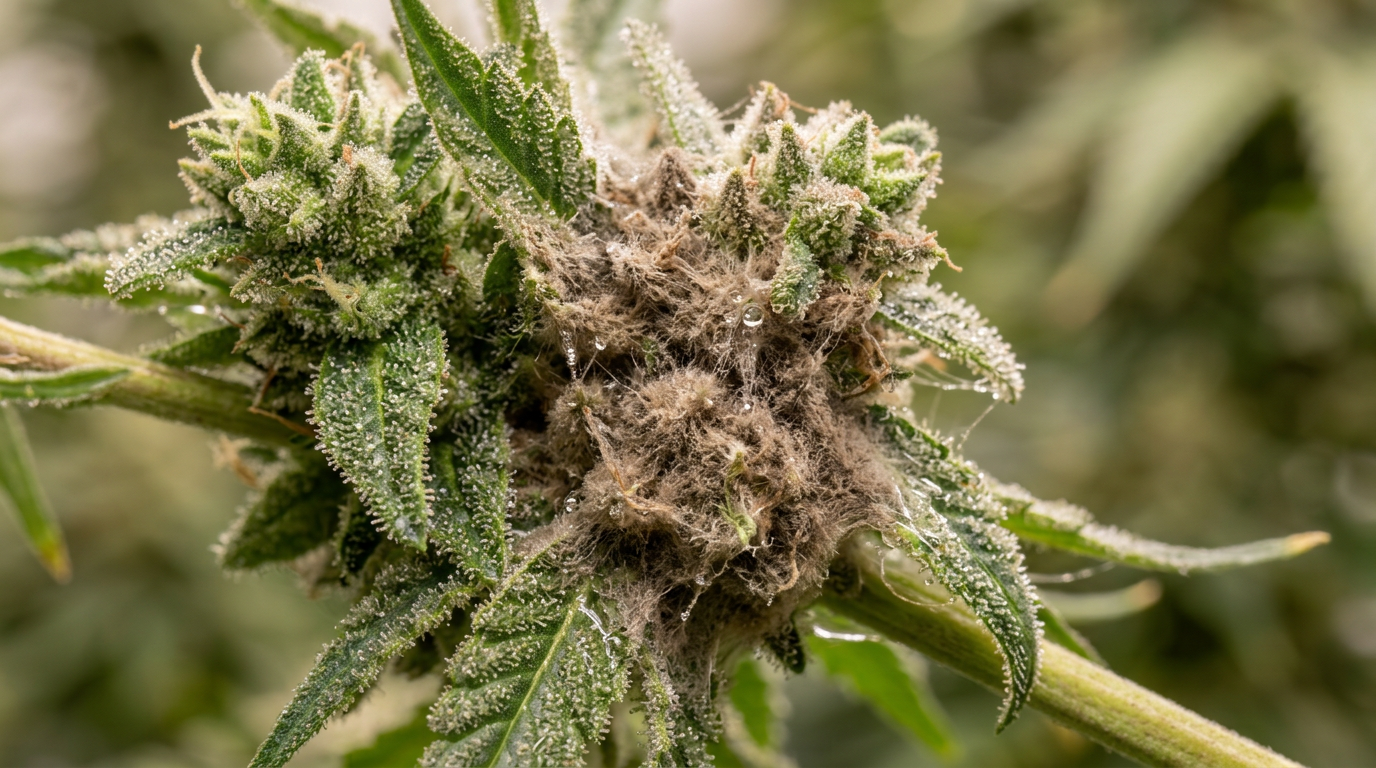
VPD and Disease Prevention: The Mold and Mildew Connection
Maintaining correct VPD is one of the most effective disease prevention strategies available to cannabis cultivators, and this is a dimension of VPD management that doesn’t receive nearly enough attention in mainstream growing guides. Botrytis cinerea (gray mold/bud rot) and powdery mildew both require specific surface moisture conditions to establish and proliferate, conditions that are directly created when VPD drops below the stage-appropriate minimum.
When RH exceeds 60% during the flowering phase, the risk of botrytis infection increases exponentially, particularly in dense-budded strains. The mechanism is straightforward: low VPD means the air cannot absorb moisture from leaf and bud surfaces efficiently, allowing water films to persist on plant tissue. These water films are the primary infection vector for both botrytis spores and powdery mildew colonies. Maintaining late-flower VPD at 1.2 kPa or above, which requires RH at or below 50% at typical flowering temperatures, creates an atmospheric environment that is fundamentally hostile to fungal establishment.
This is why experienced growers in high-humidity US states like Oregon, Washington, and the Southeast treat VPD management as a biosecurity issue, not merely a growth optimization tool. I’ve reviewed grow logs from commercial operations in these states where switching from RH-based environmental control to VPD-based control reduced botrytis incidence by eliminating the low-VPD windows that previously occurred during nighttime temperature drops. The plant problems diagnosis guide covers fungal pathogen identification in detail if you’re already dealing with an active infection, but prevention through VPD management is always the superior strategy.
Common VPD Mistakes and Why Plants Fail Despite “Correct” Numbers
After years of analyzing grow data and consulting with cultivators across multiple US states, I’ve identified a consistent set of mistakes that cause growers to achieve correct room-level VPD readings while their plants still show the symptoms of VPD mismanagement. Understanding these failure modes is what separates growers who use VPD as a diagnostic tool from those who use it as a checkbox.
The most prevalent mistake is measuring temperature and humidity at the wrong location. Most growers hang their sensor at canopy height on the perimeter of the tent or room, but the actual VPD your plants experience is determined by the microclimate at the leaf surface within the canopy, not at the room perimeter. In a dense late-flower canopy, interior canopy RH can be 10–15 percentage points higher than perimeter RH, meaning your room sensor reads 50% while your buds are sitting in a 60–65% microenvironment. The solution is canopy-level sensor placement and robust oscillating airflow that continuously exchanges the canopy microclimate with the conditioned room air.
The second major mistake is ignoring the light-off VPD. Many growers optimize their VPD for the photoperiod but allow temperature to drop dramatically during the dark period, which, if RH doesn’t drop proportionally, causes VPD to collapse to 0.3–0.5 kPa for 8–12 hours per day. Stomata are largely closed during darkness, so the metabolic impact is less severe than during the light period, but the disease risk from low-VPD dark periods is very real. Maintaining dark-period temperature within 4–6°C of the light-period temperature, or actively reducing RH during lights-off, prevents this problem.
The third mistake is applying a single VPD chart to all strains regardless of phenotypic variation. Sativa-dominant genetics like Amnesia Haze or Jack Herer strain, which have evolved in lower-latitude, higher-humidity environments, often perform optimally at the lower end of each stage’s VPD range. Conversely, indica-dominant and OG-lineage strains like Og Kush strain or Northern Lights strain frequently benefit from pushing VPD toward the higher end of the acceptable range, particularly during late flower, as these genetics are adapted to drier mountain environments. The target ranges in this guide represent population-level optima, your specific phenotype may express its best at a specific point within those ranges, and finding that sweet spot requires observation across multiple grows.
Finally, many growers fail to account for the VPD impact of CO2 supplementation. Elevated CO2 levels (above 1,000 ppm) allow stomata to remain partially open at higher VPD values than they would under ambient CO2 conditions, effectively expanding the upper boundary of the optimal VPD range. Growers running CO2 supplementation can often push late-flower VPD to 1.6–1.8 kPa without triggering the drought-stress stomatal closure that would occur at the same VPD under ambient CO2. This is an advanced integration that requires precise environmental monitoring and is beyond the scope of a first-time VPD implementation, but it’s a meaningful yield optimization lever for experienced cultivators. Travis Cole, who has documented outdoor-to-indoor transition grows extensively, notes that CO2 supplementation combined with VPD optimization represents the highest-ceiling combination available to controlled-environment cultivators.
VPD Monitoring Equipment: What You Actually Need
Implementing VPD management doesn’t require expensive equipment at the entry level, but the quality of your monitoring tools directly limits the precision of your control. At minimum, every grower needs a digital thermometer/hygrometer with ±1°C temperature accuracy and ±3% RH accuracy. Consumer-grade units from brands like Govee, Inkbird, or SensorPush meet this threshold and cost under $30 USD. Units that log data over time are significantly more valuable than those that only display current readings, because VPD management requires understanding your environmental trends, not just snapshots.
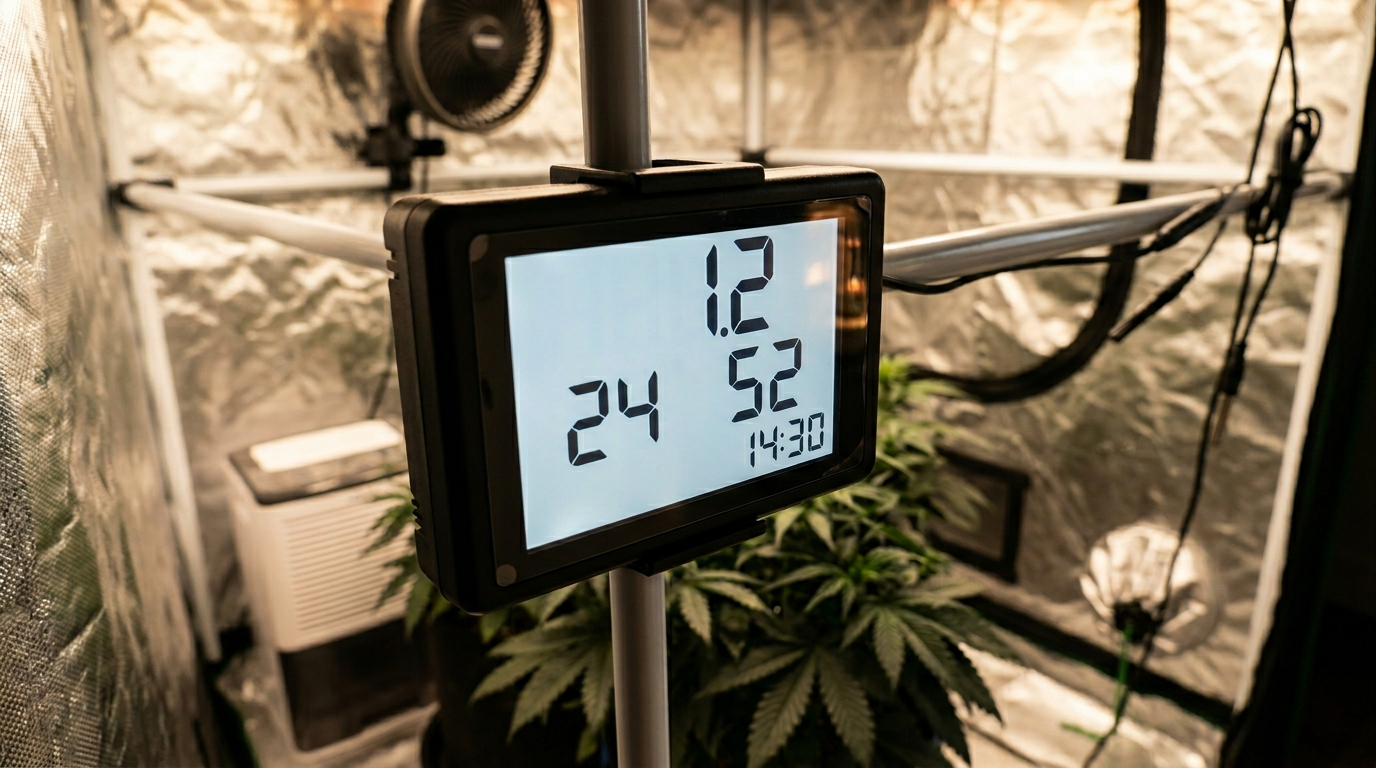
The next level up is a dedicated VPD controller or smart climate system that calculates VPD automatically from temperature and humidity inputs and can trigger dehumidifiers, humidifiers, and HVAC equipment to maintain a target VPD setpoint. Systems like Pulse Pro, TrolMaster, and Aroya (used extensively in licensed commercial operations in California, Colorado, and Oregon) represent the professional tier of VPD management infrastructure. For home growers, a quality combination controller that manages both temperature and humidity simultaneously, even without explicit VPD calculation, allows for the kind of coordinated environmental management that VPD optimization demands.
For growers who want to measure leaf temperature directly (the most accurate approach to VPD calculation), an infrared thermometer pointed at the leaf surface during the light period gives you the actual leaf temperature offset for your specific setup. In my experience, well-ventilated grows with oscillating fans typically show a 1–2°C leaf-to-air temperature differential, while poorly ventilated setups can show 3–4°C differentials that meaningfully affect VPD calculations. Taking this measurement once per grow and incorporating it into your VPD targets takes about two minutes and meaningfully improves your environmental precision.
VPD for Autoflowering Cannabis: Special Considerations
Autoflowering strains, which complete their entire lifecycle in 60–90 days regardless of photoperiod, present a unique VPD management challenge because they transition through growth stages on a compressed timeline that doesn’t always align with the grower’s environmental schedule. The VPD targets by stage remain identical to photoperiod plants, but the transitions happen faster, requiring more frequent environmental adjustments. An autoflower may spend only 2–3 weeks in true vegetative growth before beginning flower initiation, meaning the window for low-VPD vegetative optimization is narrow.
The more significant consideration for autoflowers is that many popular autoflowering genetics contain Cannabis ruderalis heritage, and ruderalis-derived genetics evolved in the harsh, variable climates of Central Asia and Eastern Europe. This genetic background often produces phenotypes that are more tolerant of VPD variation than photoperiod strains, they’re built for environmental inconsistency. That said, “tolerant of variation” doesn’t mean “indifferent to optimization.” Autoflowers grown in well-managed VPD environments consistently produce denser, more resinous flowers than those grown under casual RH management, even if they don’t show the dramatic stress symptoms that photoperiod plants exhibit under poor VPD conditions. Understanding the differences between seed types helps contextualize why VPD management strategies may need to differ between your autoflower and photoperiod grows.
Integrating VPD with Your Full Environmental Strategy
VPD doesn’t operate in isolation, it is one node in a web of interconnected environmental variables that collectively determine your plant’s metabolic rate and final yield. Understanding how VPD interacts with the other major environmental inputs is what enables truly optimized cultivation.
Light intensity and VPD are deeply coupled: higher PPFD (photosynthetic photon flux density) drives higher photosynthesis rates, which increases the plant’s demand for CO2 and water, both of which are supplied via stomatal opening, which is regulated by VPD. Running high light intensity (above 600 μmol/m²/s) with low VPD is a common mismatch that results in photosynthetic limitation: the plant has abundant light energy but cannot open its stomata fully to supply CO2, so photosynthesis is bottlenecked at the gas exchange step. Matching your VPD target to your light intensity, increasing VPD slightly when pushing high-intensity lighting, is an advanced optimization that pays measurable dividends in dense, resin-heavy canopies.
Nutrient delivery is also VPD-dependent in ways that affect how you should interpret deficiency symptoms. Calcium and magnesium, the two most commonly deficient secondary nutrients in cannabis cultivation, are transported almost exclusively via the transpiration stream, they move with water from roots to leaves, and they cannot be redistributed once deposited. When VPD is chronically low and transpiration is suppressed, calcium deficiency symptoms (tip burn, blossom end rot equivalent in cannabis) can appear even when your reservoir calcium concentration is perfectly adequate. Before adjusting your nutrient solution in response to these symptoms, always check and correct your VPD first. The yield optimization hierarchy positions VPD management as a foundational environmental control that must be established before nutrient and training optimizations deliver their full returns.
Super cropping and other high-stress training techniques, which our super cropping guide covers in detail, create temporary transpiration disruptions as damaged tissue heals. During the 24–72 hours after a significant training event, I recommend backing VPD down slightly to the lower end of the stage-appropriate range to reduce transpiration demand while vascular tissue repairs, a small adjustment that meaningfully accelerates recovery and reduces the yield penalty from training stress.
VPD Chart Tools: Comparing Your Options
The cannabis growing community has developed several excellent VPD chart resources, each with distinct strengths depending on your workflow. The interactive calculator at vpdchart.com is the most widely referenced tool in online growing communities, it allows real-time input of temperature, humidity, and leaf temperature offset to calculate precise VPD, and it displays the result against stage-appropriate optimal ranges. The interface is clean, mobile-friendly, and free, making it the go-to reference for daily grow room checks.
Pulse Grow’s downloadable VPD charts in both Celsius and Fahrenheit with leaf temperature correction are the most commonly printed reference materials in grow rooms I’ve visited, they’re laminated and hung next to environmental controllers in everything from California home grows to Oregon commercial operations. The advantage of a printed chart over a digital tool is reliability: no phone required, no loading time, no interface to navigate when you’re in the middle of a grow room adjustment.
For growers who want to integrate VPD calculation into their existing grow automation, most modern grow controllers (TrolMaster, Aroya, Pulse Pro) include built-in VPD calculation that displays continuously and can be used to trigger automated environmental responses. This represents the highest level of VPD management precision available and is increasingly standard in licensed commercial operations across legal US states.
The key limitation of all VPD chart tools, including the interactive calculators, is that they calculate VPD from air temperature and humidity inputs, not direct leaf temperature measurement. As I noted earlier, the true plant-level VPD is determined by leaf surface temperature, and using air temperature introduces a systematic overestimation. The best tools allow you to input a leaf temperature offset to correct for this; when using tools that don’t offer this feature, mentally subtract 0.05–0.10 kPa from the displayed VPD value to approximate the actual leaf-level condition.
Frequently Asked Questions About Cannabis VPD
What should your VPD be for weed at each growth stage?
VPD targets for cannabis are stage-dependent and should be adjusted throughout the plant’s lifecycle: seedlings and clones perform best at 0.4–0.8 kPa, early vegetative growth targets 0.4–0.8 kPa, late vegetative growth moves up to 0.8–1.1 kPa, early flowering targets 1.0–1.2 kPa, and late flowering pushes to 1.2–1.6 kPa before dropping slightly to 1.0–1.3 kPa during the final ripening phase. These ranges reflect the changing transpiration demands and disease risk profiles at each stage of development. Using a single VPD target for your entire grow is one of the most common optimization mistakes I see.
What is considered a high VPD for cannabis?
A VPD above 1.6 kPa is generally considered high for cannabis and can cause plant stress through excessive, uncontrolled transpiration, stomata close as a drought-stress response, nutrient transport stalls, and plants show symptoms that mimic deficiency. During late flowering, 1.6 kPa represents the upper boundary of the acceptable range rather than a stress threshold, but pushing above this level at any stage risks triggering the stress response that suppresses yield and terpene production. In practice, VPD above 2.0 kPa is unambiguously damaging at any growth stage.
Is 1.6 VPD too high for cannabis during flowering?
A VPD of 1.6 kPa is not too high during late flowering, it sits at the upper boundary of the optimal late-flower range (1.2–1.6 kPa) and is well-tolerated by most strains during weeks five through eight of flowering. At this stage, the elevated atmospheric drying pressure actively supports resin production and dramatically reduces botrytis risk. However, 1.6 kPa would be too high during seedling, early veg, or early flower stages, where the optimal range tops out at 0.8 kPa, 1.1 kPa, and 1.2 kPa respectively. Context, specifically growth stage, is everything when evaluating whether a given VPD reading is appropriate.
Can VPD be too high, and what happens?
Yes, VPD can absolutely be too high, and the consequences are measurable and damaging. Excessive VPD causes rapid, uncontrolled transpiration that outpaces the root system’s ability to replenish moisture, the plant responds by closing stomata, which simultaneously blocks CO2 uptake and nutrient transport. The visible result is wilting, tip curl (the classic “taco leaf” symptom), and nutrient deficiency symptoms despite adequate reservoir concentrations. Chronically high VPD during flowering suppresses terpene biosynthesis, reduces final cannabinoid concentrations, and can cause premature senescence. In arid climates, this is a more common problem than low VPD and requires active humidification to correct.
How do you read a VPD chart for cannabis?
Reading a cannabis VPD chart is straightforward: locate your current air temperature on the horizontal axis, trace upward to your current relative humidity on the vertical axis, and read the VPD value at that intersection, the cell color (blue/green/yellow/red) indicates whether you’re below, within, or above the optimal range for your growth stage. The critical refinement is knowing which optimal zone applies to your current stage (seedling, veg, early flower, late flower) and applying a leaf temperature offset of approximately 2°C to air temperature for more accurate plant-level VPD estimation. Most online VPD calculators, including vpdchart.com, allow you to input this offset directly.
What RH should I maintain during the flowering stage?
During the flowering stage, relative humidity should generally be maintained between 45–55% for early flower and 40–50% for late flower, but these numbers are only meaningful in the context of your room temperature. The reason VPD-based management is superior to RH-based management is precisely that the correct RH target depends entirely on temperature: at 24°C, 50% RH produces a VPD of approximately 1.49 kPa (appropriate for late flower), while at 20°C, 50% RH produces a VPD of approximately 1.17 kPa (appropriate for early flower). Chasing a fixed RH target without accounting for temperature is why many growers following the “50–60% RH for flower” rule still encounter disease problems or suboptimal growth, the temperature half of the equation is being ignored.
How does leaf temperature affect VPD calculations?
Leaf temperature affects VPD calculations because the saturation vapor pressure that determines the VPD experienced at the stomatal level is calculated from leaf surface temperature, not air temperature, and leaf surfaces are typically 1–3°C cooler than ambient air due to evaporative cooling. Using air temperature in your VPD formula therefore overestimates the actual drying pressure your plants experience. In practical terms, if your VPD chart shows 1.4 kPa based on air temperature, the actual leaf-level VPD may be closer to 1.2–1.3 kPa after accounting for the leaf temperature offset. For most home grows, applying a 2°C correction to air temperature before reading your VPD chart provides adequate accuracy. Growers running infrared thermometers can measure actual leaf temperature directly for the most precise calculation.
For more in-depth coverage of related growing science and strain-specific cultivation data, browse our cannabis blog, it’s regularly updated with research-backed content across cultivation, chemistry, and consumer topics.